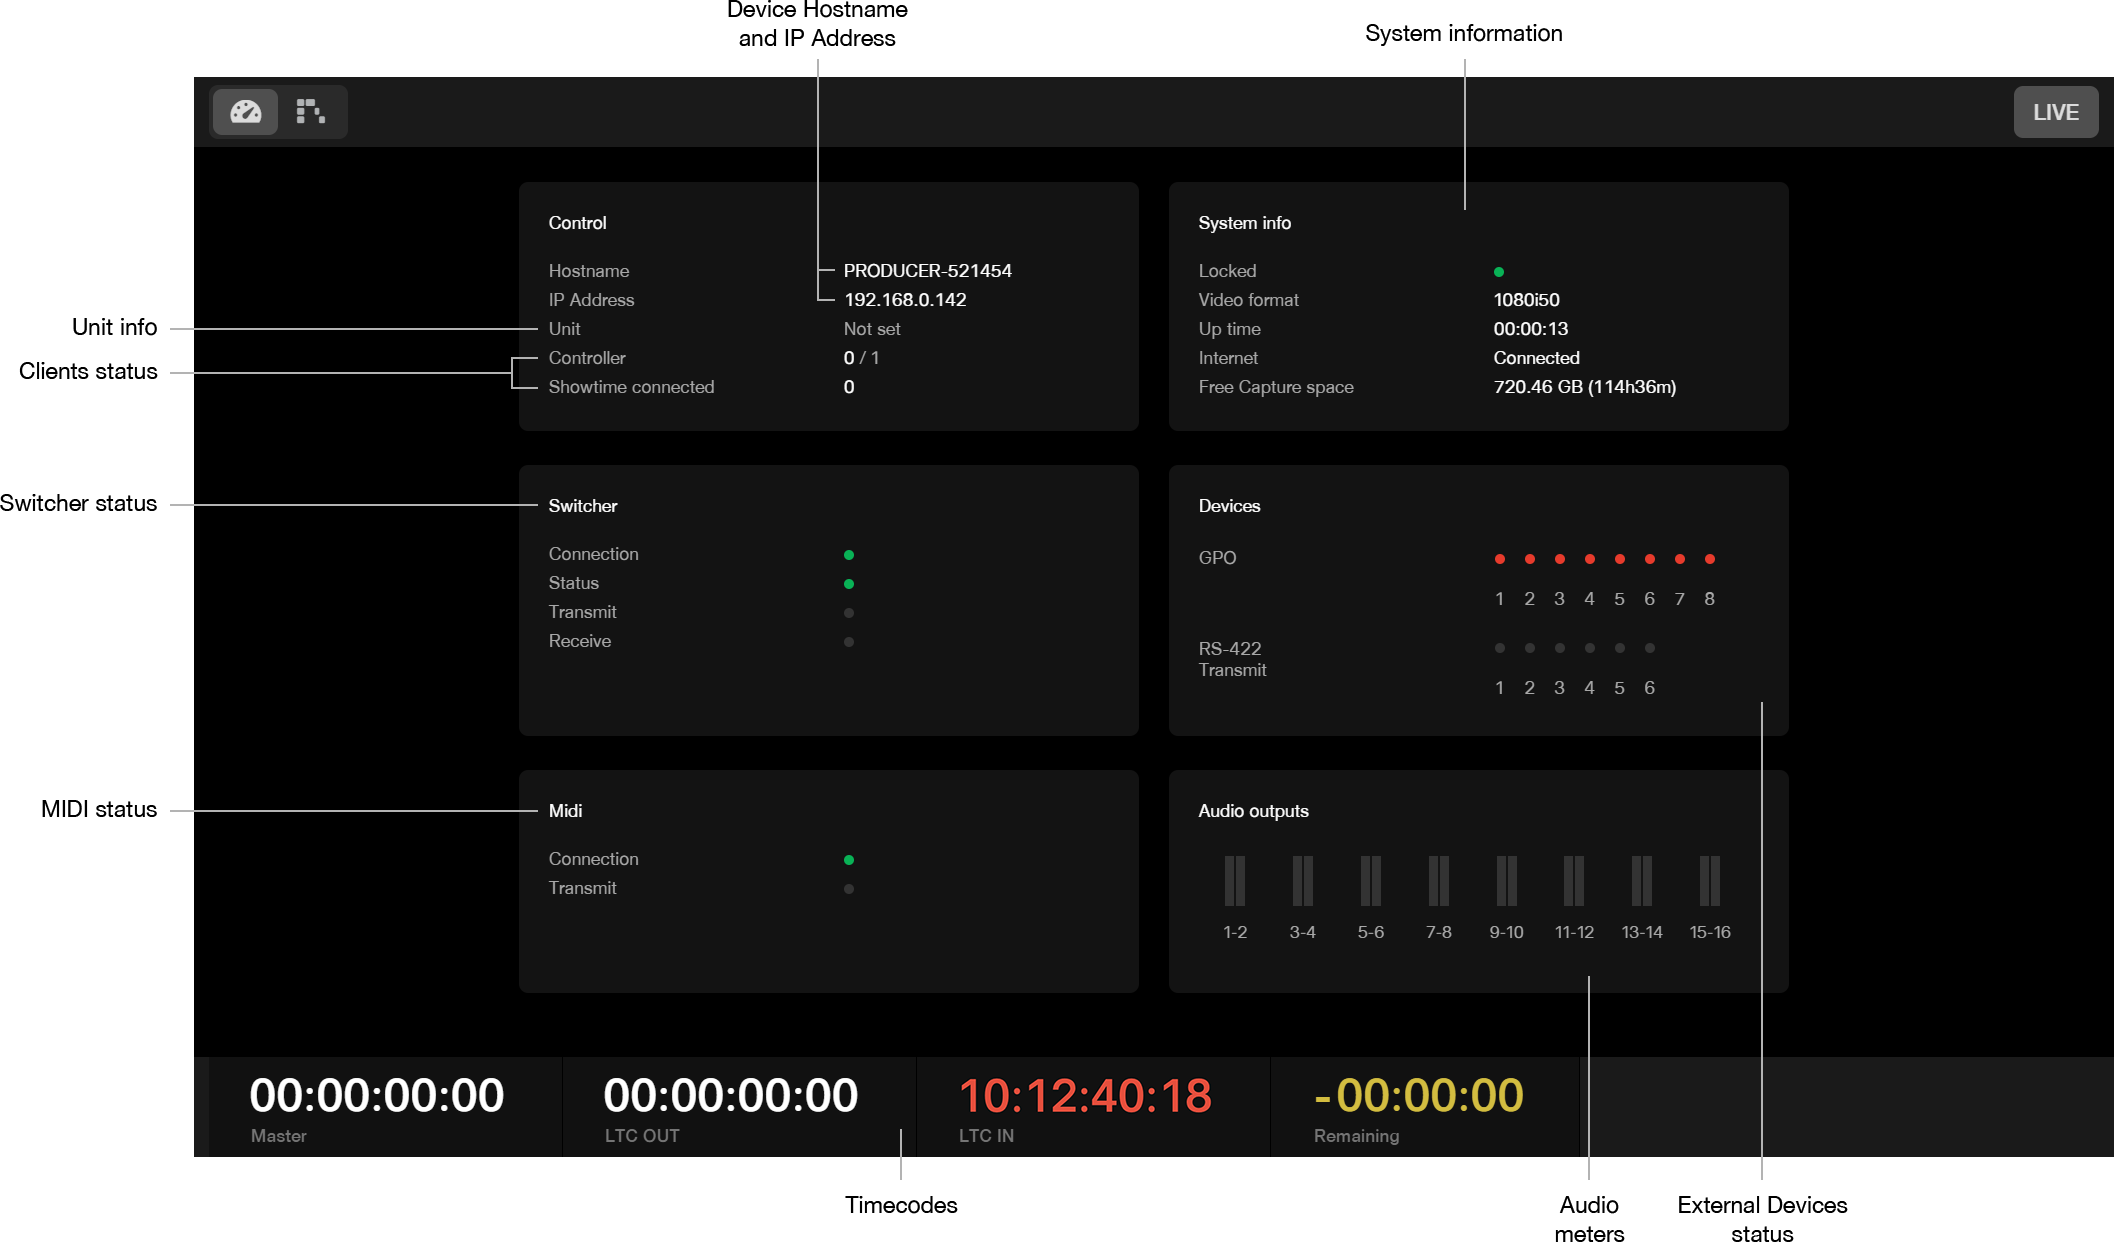
Overview of the dashboard view
At startup, the monitoring HD-SDI of your Producer displays the dashboard view.

- Device Hostname and IP Address: this is one of the info you need to enter in the Producer connection window of the LiveEdit App in order to connect this device.
- System information: this section describe current system info such as video reference presence, internet connection status, remaining capture capacity...
- External Devices status: this summarizes the status of external devices such as GPO and RS-422 devices
- Audio meters: displays the levels for built-in audio outputs 1-16
- Timecodes: an overview of all incoming and outgoing timecodes, as well as the time remaining before the end of the timeline
- MIDI status: this summarizes the MIDI connection status
- Switcher status: this summarizes the Switcher connection and device status
- Clients status: this displays the number of LiveEdit Apps controlling this device (Controller) and the number of connected Showtime Apps
- Unit info: displays the device level as defined in the controlling LiveEdit App (Main, Secondary or Backup)
Once a first scene is loaded from the controlling LiveEdit application, the monitoring output automatically switches to the "waterfall view".
All this information is available at any time in Producer Web UI.
Tip!: Press the F1 and F2 keys on your keyboard to switch between "dashboard" and "waterfall" views.